10 Logistic Regression (Binary Response)
Determination of the effective dose of a herbicide under field, greenhouse, or laboratory conditions is a common goal of weed science experiments. Although the response variable in some cases is continuous (dry weight) or percent (visual injury), in many cases the response variable of interest is a binary response, such as mortality (the plant is alive or dead). This type of data is important in many types of toxicology and pest management, and weed science is no exception. In many ways the analysis of binary response data is analogous to using ANOVA followed by non-linear regression.
10.1 Generalized Linear Model
Instead of fitting a linear model using the lm() function, analysis of binary response data requires the use of a generalized linear model with the glm() function. For this example, the data set has mortality observations collected 21 days after treatment with six rates of imazamox with and without six different growth regulator herbicides.
rye.dat <- read.csv("http://rstats4ag.org/data/2012_RyeGH.csv")
rye.glm <- glm(mort.21dat ~ imaz.rate + gr, data = rye.dat,
               family = binomial(link = "logit"))
anova(rye.glm, test = "Chisq")
## Analysis of Deviance Table
##
## Model: binomial, link: logit
##
## Response: mort.21dat
##
## Terms added sequentially (first to last)
##
##
## Df Deviance Resid. Df Resid. Dev Pr(>Chi)
## NULL 430 464.54
## imaz.rate 1 93.502 429 371.04 < 2.2e-16 ***
## gr 7 31.180 422 339.86 5.759e-05 ***
## ---
## Signif. codes: 0 '***' 0.001 '**' 0.01 '*' 0.05 '.' 0.1 ' ' 1Using anova() on the glm() fit results in an analysis of deviance table with a similar interpretation as an ANOVA table for continuous response data. Both the imazamox rate and growth regulator herbicide significantly affected the mortality of feral rye, which was the expected result. The drc package can be used to quantify the response of feral rye to imazamox in the presence and absence of the growth regulator herbicides.
library(drc)
rye.drc <- drm(mort.21dat ~ imaz.rate, gr, data = rye.dat, fct = LL.2(),
               type = "binomial", na.action = na.omit)
## Control measurements detected for level: Controlsummary(rye.drc)##
## Model fitted: Log-logistic (ED50 as parameter) with lower limit at 0 and upper limit at 1 (2 parms)
##
## Parameter estimates:
##
## Estimate Std. Error t-value p-value
## b:None 1.31358 0.52697 2.4927 0.0126766 *
## b:2,4-D amine 1.93438 0.63004 3.0702 0.0021389 **
## b:2,4-D ester 1.83033 0.45369 4.0343 5.476e-05 ***
## b:MCPA amine 2.00705 0.67980 2.9524 0.0031531 **
## b:MCPA ester 1.16337 0.34724 3.3503 0.0008071 ***
## b:dicamba 2.38035 0.79232 3.0043 0.0026623 **
## b:fluroxypyr 1.93821 0.63093 3.0720 0.0021264 **
## e:None 97.74085 48.66554 2.0084 0.0445987 *
## e:2,4-D amine 61.90448 15.27230 4.0534 5.048e-05 ***
## e:2,4-D ester 25.55234 4.80647 5.3162 1.059e-07 ***
## e:MCPA amine 66.09968 16.64430 3.9713 7.148e-05 ***
## e:MCPA ester 28.58611 7.85012 3.6415 0.0002711 ***
## e:dicamba 62.04112 12.76510 4.8602 1.173e-06 ***
## e:fluroxypyr 61.84463 15.21629 4.0644 4.816e-05 ***
## ---
## Signif. codes: 0 '***' 0.001 '**' 0.01 '*' 0.05 '.' 0.1 ' ' 1EDcomp(rye.drc, c(50,50))##
## Estimated ratios of effect doses
##
## Estimate Std. Error t-value p-value
## 2,4-D amine/2,4-D ester:50/50 2.4227e+00 7.5160e-01 1.8928e+00 5.8379e-02
## 2,4-D amine/dicamba:50/50 9.9780e-01 3.2054e-01 -6.8712e-03 9.9452e-01
## 2,4-D amine/fluroxypyr:50/50 1.0010e+00 3.4876e-01 2.7746e-03 9.9779e-01
## 2,4-D amine/MCPA amine:50/50 9.3653e-01 3.3015e-01 -1.9224e-01 8.4755e-01
## 2,4-D amine/MCPA ester:50/50 2.1655e+00 7.9943e-01 1.4580e+00 1.4485e-01
## 2,4-D amine/None:50/50 6.3335e-01 3.5194e-01 -1.0418e+00 2.9751e-01
## 2,4-D ester/dicamba:50/50 4.1186e-01 1.1482e-01 -5.1224e+00 3.0171e-07
## 2,4-D ester/fluroxypyr:50/50 4.1317e-01 1.2796e-01 -4.5860e+00 4.5186e-06
## 2,4-D ester/MCPA amine:50/50 3.8657e-01 1.2150e-01 -5.0487e+00 4.4489e-07
## 2,4-D ester/MCPA ester:50/50 8.9387e-01 2.9753e-01 -3.5669e-01 7.2132e-01
## 2,4-D ester/None:50/50 2.6143e-01 1.3915e-01 -5.3079e+00 1.1091e-07
## dicamba/fluroxypyr:50/50 1.0032e+00 3.2175e-01 9.8746e-03 9.9212e-01
## dicamba/MCPA amine:50/50 9.3860e-01 3.0521e-01 -2.0117e-01 8.4056e-01
## dicamba/MCPA ester:50/50 2.1703e+00 7.4473e-01 1.5715e+00 1.1607e-01
## dicamba/None:50/50 6.3475e-01 3.4197e-01 -1.0681e+00 2.8548e-01
## fluroxypyr/MCPA amine:50/50 9.3563e-01 3.2939e-01 -1.9543e-01 8.4506e-01
## fluroxypyr/MCPA ester:50/50 2.1635e+00 7.9769e-01 1.4585e+00 1.4470e-01
## fluroxypyr/None:50/50 6.3274e-01 3.5141e-01 -1.0451e+00 2.9598e-01
## MCPA amine/MCPA ester:50/50 2.3123e+00 8.6153e-01 1.5232e+00 1.2770e-01
## MCPA amine/None:50/50 6.7627e-01 3.7733e-01 -8.5793e-01 3.9093e-01
## MCPA ester/None:50/50 2.9247e-01 1.6630e-01 -4.2545e+00 2.0950e-05Please note that the test for significant relative potency is not a null hypothesis, but that the relative potency SI is different from unity.
par(mar=c(3.2,3.2,.5,.5), mgp=c(2,.7,0))
plot(rye.drc, legendPos=c(10,0.6), col=T, xt=unique(rye.dat$imaz.rate),
     broken=T, bp=1.5, xlim=c(0,100),xlab="Imazamox rate", bty="l",
     ylab="Probability of survival 21 DAT")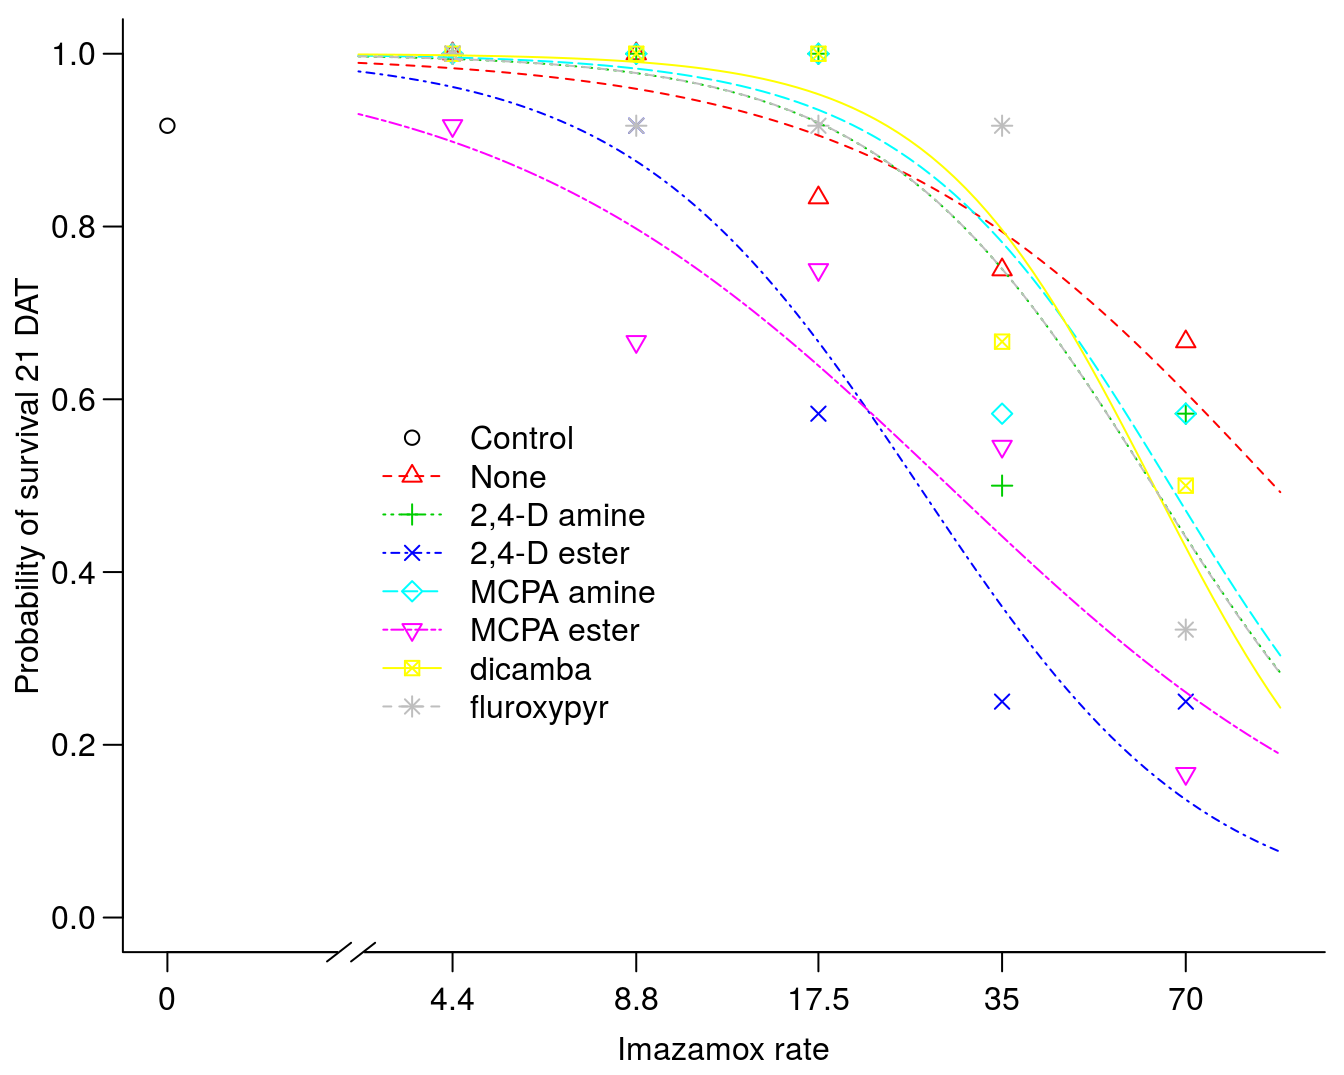
Figure 10.1: The effect of imazamox rate with and without auxin-mimic herbicides on rye survival.